Data show statistical significance at four major efficacy parameters
Oxford, October 7, 2011 – Oxford Biolabs Ltd., a UK-based company focusing on the research and development of therapies promoting well-being, presents the results of the company’s preliminary clinical research study of TRX2®. TRX2® contains nutrients that help maintain normal hair. Click here for more information.
9 months (active treatment group)
- Hair count (Mean number of hair in an area of 2×2 cm): +35.1%
- Hair thickness (Mean weight of hair – bundle of 30 strands): +22.5%
- Terminal hair change (% change from vellus to non-vellus): +23.2%
- Self-evaluation of satisfaction (score between 0-10 cm with 10 being the most satisfied): 7.8 ± 2.0 cm
18 months (active treatment group)
- Hair count (Mean number of hair in an area 2×2 cm): +49.2%
- Hair thickness (Mean weight of hair – bundle of 30 strands): +38.7%
- Terminal hair change (% change from vellus to non-vellus): +36.4%
- Self-evaluation of satisfaction(score between 0-10 cm with 10 being the most satisfied): 8.6 ± 1.6 cm

- A blinded phase lasting for 9 months; participants were receiving either TRX2® formulation supplementation (active treatment group) or placebo (placebo group)
- An open phase; participants who had taken TRX2® were continuing treatment for a further 9 months (active treatment group); participants who had been taken placebo during the blinded phase were switched to active TRX2® treatment for 9 months (switched group).Treatment
- Hair count (primary efficacy measure). For each patient an area of 2×2 cm was selected within the area affected by hair loss (usually frontal area or crown) – the two opposing corners of the 2×2 cm square were permanently marked using a 4 cm 2 wire frame to ensure consistency in measurements for the participant’s following intervals.
- Terminal hair % change. At each interval the percentage terminal hair count change (% change from vellus to non-vellus hair) was determined
- Hair weight. At each of the intervals a small bundle of hair (ca. 30 strands) within the marked zone was clipped. 30 strands were then randomly chosen and normalized by cutting them into 1 cm in length. The total weight was measured by using a microbalance and the mean weight was recorded.
- Self-evaluation of satisfaction on a visual analogue scale (0-10 cm). At each interval the subjects were asked about their satisfaction with the treatment by scoring their degree of satisfaction on a visual analogue scale between 0 and 10 cm (with 0 being “not at all satisfied” and 10 being “very satisfied”). The measured distance between the zero point to the subject’s mark on the visual analogue scale was used during statistical evaluation. All participants were asked if they had positive or negative comments from their hairdresser, friends and family members. Each participant was also asked for any side-effects they may have encountered as a result of the treatment.

Figure 1. Graphical representation of total hair count as a result of TRX2® and placebo. A) Total hair count change of TRX2® in the active treatment group (left), placebo in the placebo group (middle) and TRX2® in the group that was switched from placebo to TRX2® after 9 months (switched group) (right). Time intervals are indicated in different colors (blue coloring). Each box represents the mean number of hair in a defined area of 2×2 cm. The black bar within the boxes indicates the mean. Each box has whiskers attached, which indicate the 10-90-percentile range of the data points collected (black dots). B) Total hair count change in the active treatment group with standard deviation (SD) indicated by the black bars. C) Total hair count change in the placebo group (grey color) and switched group (blue color) with standard deviation (SD) indicated by the black bars.
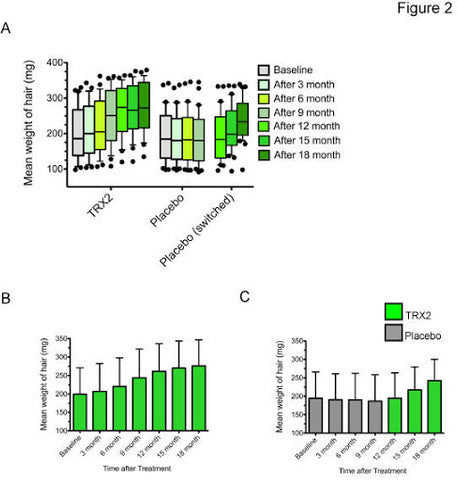
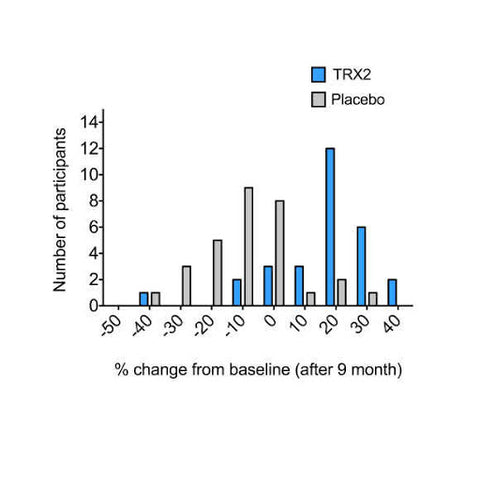
Figure 3. Graphical representation of percentage terminal hair count change (change from non-vellus to vellus hair) achieved by TRX2® formulation supplementation and placebo after 9 months.
TABLE 1:
Values are number (gender) or mean ± SD
TABLE 2:
a For each patient an area of 2×2 cm was selected within the area affected by hair loss (usually frontal area or crown) – the two opposing corners of the 2×2 square were permanently marked using a 4 cm2 wire frame to ensure consistency in measurements for the participant’s following intervals bp<0.001 versus placebo
TABLE 3:
Values are mean ± SD a p<0.001 versus placebo after 9 months; b p<0.01 versus 9 months of TRX2 ® supplementation (blinded phase). During the blinded phase, participants were given either placebo (n= 30) or TRX2 ® (n=29) over a period of 9 months. During the open phase, participants who had been taking TRX2 ® during the blinded phase, continued with this treatment for a further 9 months. Participants who had been taking placebo during the blinded phase were switched to TRX2 ® for 9 months.
